Profit factor vs. expectancy: which one predicts your future?
Two of the most-quoted trading metrics measure different things. Here is what each one really tells you, where each one lies, and which to trust when they disagree.
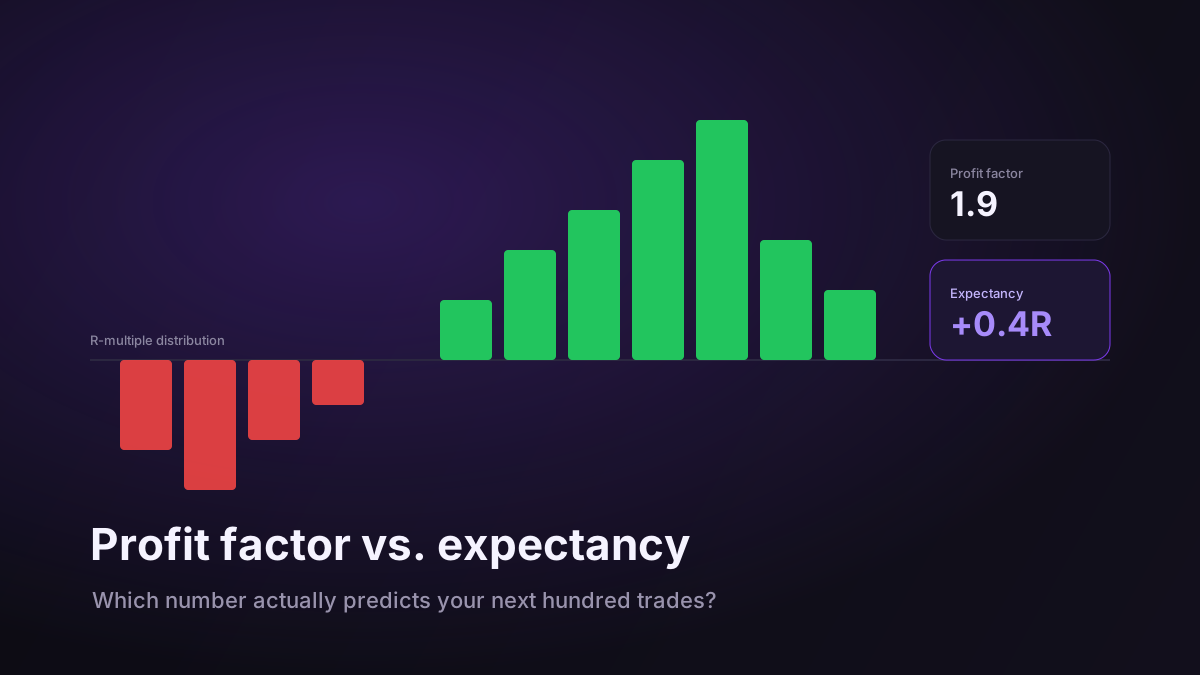
Profit factor and expectancy are the two numbers traders reach for when they want to sound rigorous, and they are constantly used as if they were interchangeable. They are not. They measure different things, they fail in different ways, and when they disagree, the disagreement itself is the most useful signal you will get. Understanding the difference is the difference between reading your stats and being fooled by them.
What each one actually measures
Profit factor is gross profit divided by gross loss — the total dollars your winners made divided by the total dollars your losers cost. A profit factor of 1.8 means you earned 1.80 for every 1.00 you gave back. It is a ratio of totals.
Expectancy is the average outcome of a single trade, ideally expressed in R. It answers "what does one more trade, on average, add to or subtract from my account?" It is a per-trade average.
The distinction matters because one is about the aggregate and the other is about the typical. A metric of totals and a metric of averages can tell very different stories about the same track record.
Where profit factor lies
Because profit factor sums everything together, it is dangerously easy for a single outlier to carry it. One enormous winning trade — the news spike you happened to be on the right side of — can lift a mediocre profit factor into "professional" territory. The number looks great, but it describes a lottery ticket, not a repeatable edge. Strip out that one trade and the picture collapses.
Profit factor also says nothing about the path. Two traders with an identical 1.7 can have wildly different experiences: one grinds steadily upward, the other rides a stomach-churning rollercoaster to the same place. The ratio cannot see the difference.
Where expectancy lies
Expectancy has the opposite weakness. As an average, it hides the distribution around it. A positive expectancy of 0.3R sounds healthy, but if it comes from many small losses and a handful of gigantic wins, the average flatters a system you may not be able to trade psychologically — long strings of red between the rare green that pays for everything. The average is real; living through it is another matter.
Expectancy is also silent on drawdown. A positive number tells you the destination, not the depth of the valleys on the way. Two systems with the same expectancy can have completely different survival odds.
When they disagree, investigate
Here is the practical rule. When profit factor looks strong but expectancy is thin, suspect an outlier — one or two trades are doing all the work, and the edge is not as broad as the ratio suggests. When expectancy looks solid but profit factor is unremarkable, you likely have a genuine, well-distributed edge that is simply modest in size, which is a far healthier place to be.
The two numbers cross-check each other precisely because they can be gamed in opposite directions. That is why you read them side by side.
The verdict
If you have to trust one for predicting your future, trust expectancy in R — it is per-trade, size-neutral, and tells you what the next trade is worth. But never read it alone. Pair it with profit factor to catch outliers, and with maximum drawdown to know whether you can stomach the ride. A journal that shows all three on the same screen, over a sample large enough to matter, is how you tell a real edge from a lucky one — before the market tells you the expensive way.