Size every trade the same way: a practical guide to risk per trade
Let the stop set the lots, never let the lots set the stop. The formula takes ten seconds and removes the single biggest source of variance in most trading records.
Ask a struggling trader how they choose position size and you usually get an answer about conviction. They size up when the setup looks clean and size down when they are unsure. It feels like intelligence. It is actually the reason their results are unreadable — because when size varies with feeling, you can no longer tell whether a profitable month came from a good edge or from happening to be heavy on the winners.
Fixed fractional sizing solves this, and it is not complicated.
The formula
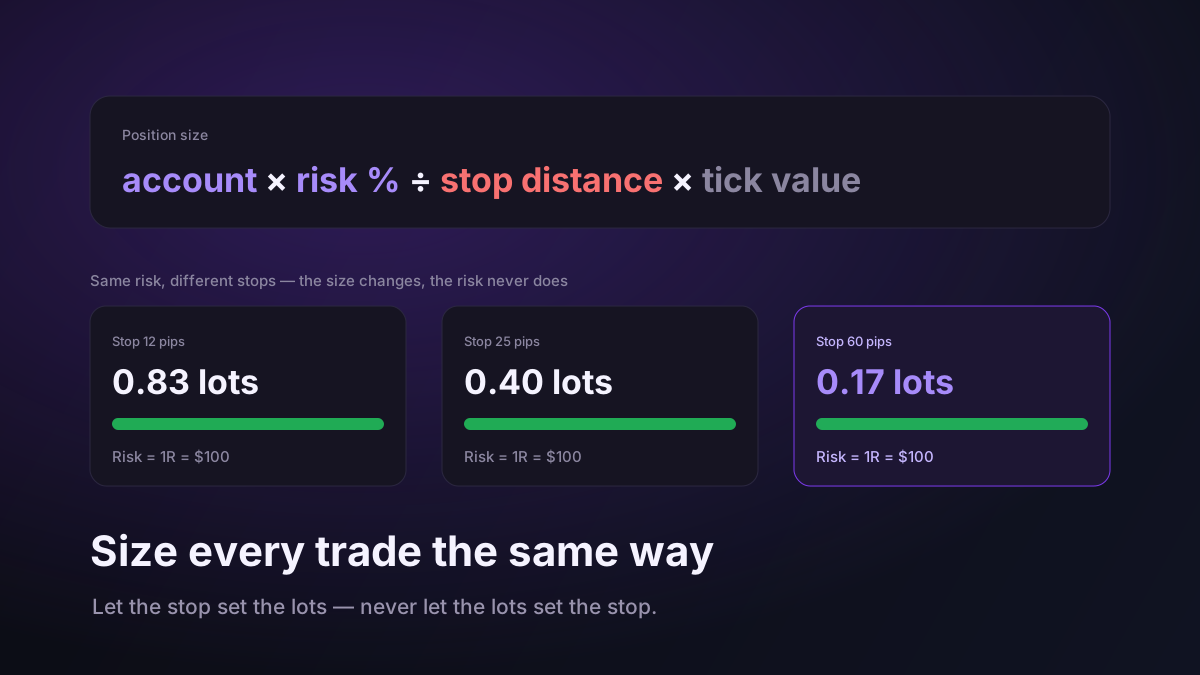
size = (account × risk %) ÷ (stop distance × value per unit)
That is it. You decide the percentage of the account you are willing to lose on one idea — call it 1% — and the stop distance is dictated by the chart, not by what size you wanted to trade. The formula then tells you the lots. You do not get a vote.
A worked example. A $10,000 account risking 1% means $100 on the line. On a pair where a pip is worth $10 per lot:
- A 12-pip stop gives 100 ÷ (12 × 10) = 0.83 lots.
- A 25-pip stop gives 100 ÷ (25 × 10) = 0.40 lots.
- A 60-pip stop gives 100 ÷ (60 × 10) = 0.17 lots.
Three completely different position sizes. Identical risk. That is the whole point: the size absorbs the volatility so your exposure stays constant.
Why the reverse destroys accounts
The common failure is picking a size first — "I trade one lot" — and then placing the stop wherever that size makes the dollar loss tolerable. On a wide-stop setup, one lot means an unacceptable loss, so the stop gets tightened into the noise and stopped out on a wick. On a tight-stop setup, one lot under-risks a good opportunity. Either way the stop is serving the size instead of the structure, and structure is the only reason a stop has any information in it.
Pick the percentage from your drawdown, not your ambition
How much per trade? Work backwards from a losing streak you can live through. At 1% risk, ten straight losers costs about 10% of the account. At 3%, the same streak costs 26% and you will need a 35% gain just to get back to flat. Under prop firm rules, 3% is usually fatal.
Most consistently profitable retail traders live between 0.5% and 1%. If that feels too slow, the honest fix is a better edge or more capital — not more risk. Leverage does not create expectancy; it only amplifies whatever expectancy you already have, in both directions.
Log it in R and the noise disappears
Once every trade risks the same fraction, express outcomes in R — multiples of what you risked. A win is +2.1R, a loss is -1R, a scratch is +0.1R. Dollars stop mattering, account growth stops distorting comparisons, and a trade from when your account was $5,000 is directly comparable to one from when it was $50,000.
That is what makes expectancy computable and a track record readable. Sizing consistently is not just risk management — it is the precondition for your statistics meaning anything at all.
The habit
Before every entry: where is the invalidation, what is the distance, what percentage am I risking, what size does that give me. Ten seconds. Then place it and do not touch the size because the setup "looks really good." The setups that look best are the ones you are most emotionally involved in, and emotional involvement is not an edge.