The five numbers that prove you have an edge
Forget the noise. Five numbers tell you whether your trading is a business or a hobby — and each one has to be read honestly to mean anything.
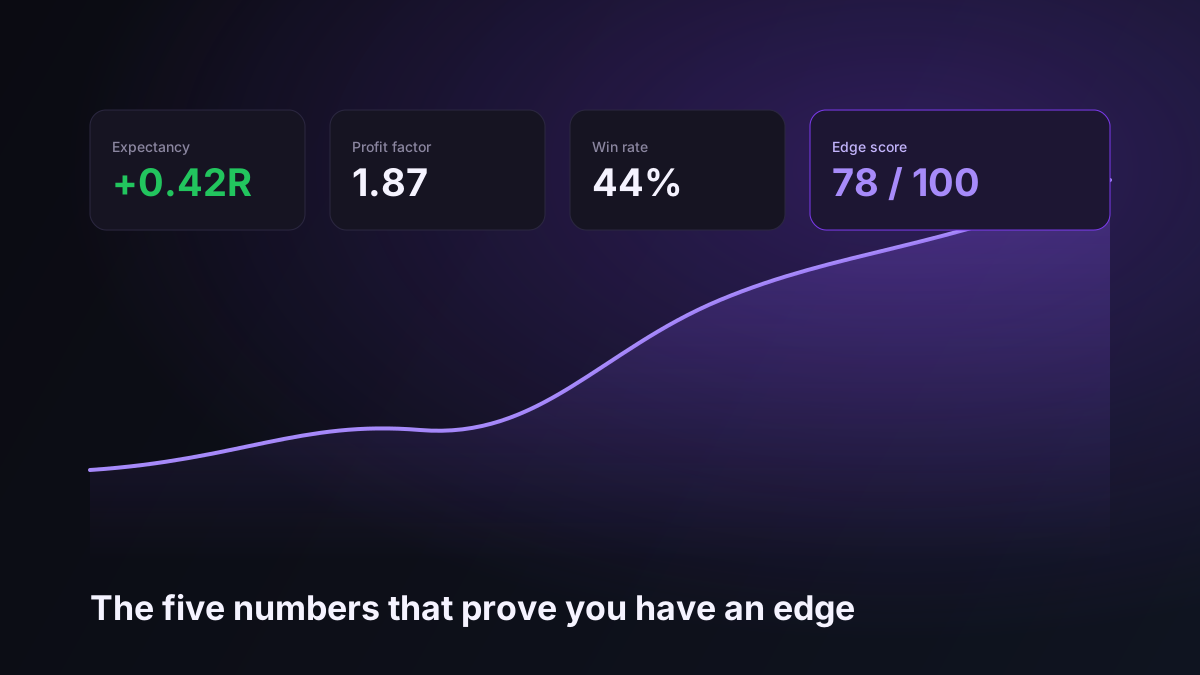
Most trading dashboards drown you in metrics, and most of them do not matter. You do not need forty numbers to know whether you have an edge. You need five, read honestly and tracked over a large enough sample to survive variance. Here they are, and what each one is really telling you.
1. Expectancy (in R)
Expectancy is the headline. It answers the only question that matters: on average, how much does one trade make or lose? Measured in R — multiples of the amount you risked — it strips out position size so a big win on a huge position and a small win on a tiny one are compared fairly.
The formula is simple: (win rate x average win) - (loss rate x average loss), all in R. If it is positive and your risk per trade is sane, you have a business. If it is negative, no amount of discipline saves you — you are just losing more slowly. Every other number on this list exists to explain why expectancy is what it is.
2. Average win vs. average loss
This ratio is the engine room. It tells you whether you let winners run and cut losers, or the reverse. A trader who wins 2R on average and loses 1R has enormous room to be wrong — they can lose more often than they win and still compound. A trader whose average loss is bigger than their average win is fighting the math on every trade.
Watch this number closely, because it is the one your worst habit distorts. Cutting winners early to lock in a green day and holding losers hoping they come back will wreck this ratio while flattering your win rate.
3. Win rate — as context, not a headline
Win rate is the most quoted and most misleading number in trading. On its own it tells you almost nothing: a 70% win rate can lose money and a 40% win rate can compound for years. Its only job is to give the average-win-to-loss ratio context. High win rate with a poor ratio means you are cutting winners. Low win rate with a strong ratio means you are running them. Read the two together or not at all.
4. Profit factor
Profit factor is gross profit divided by gross loss — how many dollars you make for every dollar you lose. Above 1.0 you are net positive; most durable systems live somewhere between 1.3 and 2.0. It is a useful sanity check on expectancy from a different angle, and because it aggregates everything, a single monster win cannot hide a leaky process the way a cherry-picked screenshot can. If profit factor and expectancy disagree, look for one outlier trade doing all the work.
5. Maximum drawdown
The first four numbers describe your edge. This one describes whether you will survive to trade it. Maximum drawdown is the deepest peak-to-trough fall in your equity, and it is the number that ends accounts — especially under prop-firm rules. A system with beautiful expectancy and a drawdown deeper than your risk tolerance is a system you will abandon at the worst possible moment. Track it so you size for the losing streak that is coming, not the winning one you hope for.
Read them together, over a real sample
No single number here means anything alone, and none of them mean anything over ten trades. Expectancy tells you if you have an edge; the win-to-loss ratio and win rate explain it; profit factor cross-checks it; drawdown tells you if you can live with it. Log every trade in R, let a few hundred accumulate, and read all five as one picture. When they line up, you stop flinching at losses — because a loss inside a positive-expectancy system is not a mistake. It is a cost you already priced in.